href="http://www.mathworks.com/matlabcentral/fileexchange/loadFile.do?objectId=8779&objectType=FILE">http://www.mathworks.com/matlabcentral/fileexchange/loadFile.do?objectId=8779&objectType=FILE
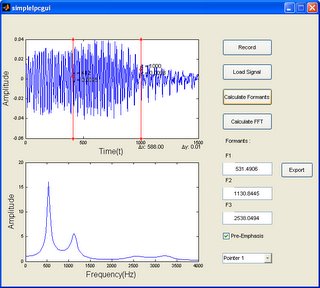
This GUI is designed to extract and visualize the spectrum of FFT and LPC of a specific frame, or a window. Following figure shows the LPC spectrum of a frame with 256 samples. The indicator on the upper subplot shows the location of the specific frame.
